
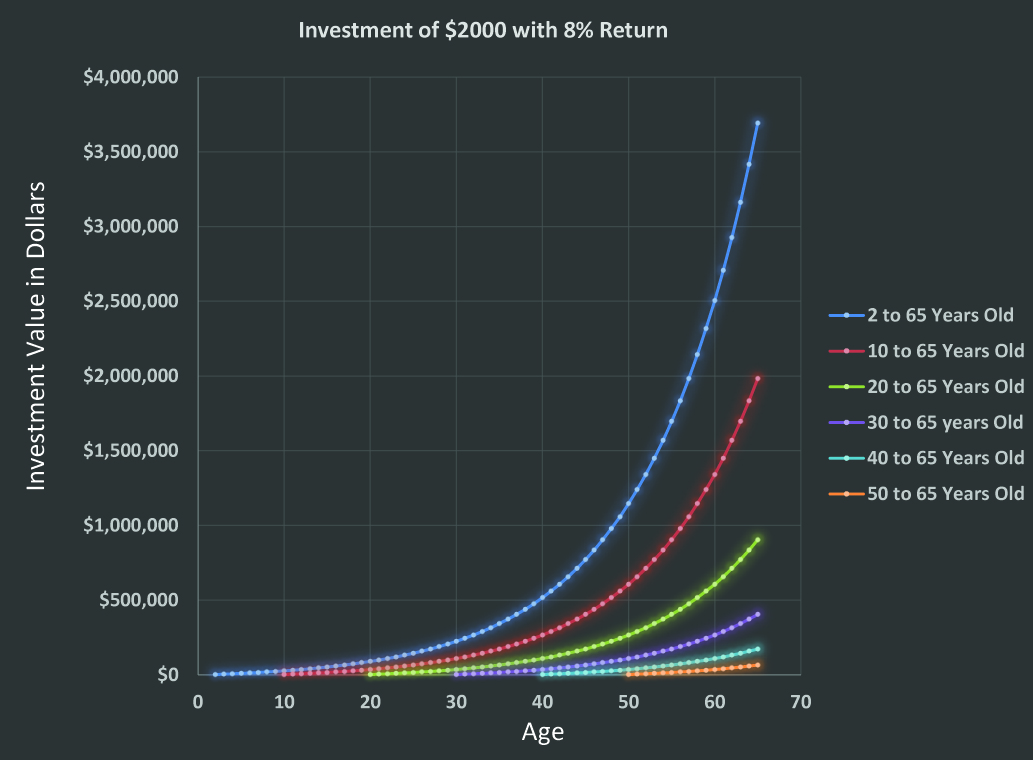
$2000 Investment with 8% Return
Investing in your early years is very important for saving for retirement. The chart below shows how investing $2000 a year starting at different ages with an 8% return on investment each year can influence your total savings by the time you turn 65. The chart assumes an investment of $2000 a year without any withdrawals over time or any tax implications. It is just intended to show the power of beginning to save as early as possible.
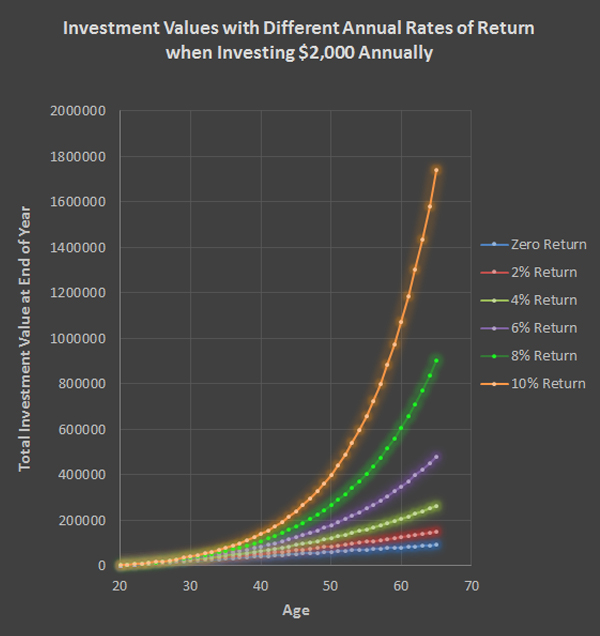
Cost of Lower Rates of Return
Investement risk is something that must be considered when investing. Safety does come at a cost, especially when investing over long periods of time. Everyone must consider their age and risk tollarence when picking their investments. Below is a graph of totals over time from investing $2,000 a year from age 20 to age 65. Values are year end dollar totals using an investement of $2000 a year at the beginning of the year given a particular interest rate. The totals are figured with no withdrawals and no taxes taken from investment. It is only to show possible totals over time and to show the cost of low risk vs. higher risk investments with annual rates of return of 0%, 2%, 4%, 6%, 8% and 10%. This graph does not promote any investment or investment type and is for hypothetical purposes only.
Investment Table for 20 Year Old
The retirement table below shows the distinct advantage of beginning to invest when you are young. This chart is a hypothetical representation of a person who starts investing at the age of 20 at the beginning of the year $2000 annually through age 65. This example uses a hypothetical annual investment growth rate of 8%. This hypothetical plan is as if someone was to invest in a tax free investment such as a Roth Ira and not removing any money and having tax free growth until age 65. If the investement is an IRA or other retirement plan it is important to check with your accountant or the IRS tax table to see how much must be removed each year to avoid extra taxes and penalties. This table just shows how a tax free investment would grow with an 8% growth rate and how taking withdrawals would affect the asset value. It is not intended to be followed. It is intended to give a person an idea of how much they could aquire and take out with these hypothetical rates. At the end of age 65 if this individual had continued to invest annually $2000 and had an annual growth rate of 8% their total investment value would be $903,800.30. At which time the person would have invested only $92,000 (46 years x $2000). After that, the retirement plan shows this person withdrawing a retirment payment plan to live on of $70,000 (at the beginning of the year) annually until age 100. Once again, this hypothetical continues to use an annual rate of return of 8% with a tax free investment (over the last hundred years the average rate of return for the U.S. stock market is about 10%). Even after withdrawing $75,000 for 35 years this person would still have an account value of $335,848.31. A person who starts their retirment plans at an older age of 49 has a much harder time saving enough for retirement.
Retirement Plans
The IRS has information, rules and regulations for the following retirement plans. Below are some brief descriptions of retirement plans available. By clicking the corresponding IRS link you can find a more in depth explanation of how the plans work and which may be appropriate for you.
IRA's - Individual Retirement Arrangements that can be tax deductible.
Roth IRAs - Non-deductible contributions that can grow tax free.
401k Plans - Qualified profit sharing plans in which employees contribute part of their wages of which some may be matched by employers.
Simple IRA Plans - A nice plan that small employers and employees can contribute to traditional IRA plans for the employees.
SEP (Simplified Employee Pension Plan) - Employers can contribute to traditional IRAs set up for employees.
SARSEP Plans - Permit employee's a salary Reduction for contributions.
Payroll Deduction IRAs - This plan is set up with businesses of any size or the self employed allowing the financial institution the ability to use payroll deductions for traditional IRAs or Roth IRAs.
Profit Sharing Plan - Employers can make discretionary contributions. Employers may or may not contribute each year. If they do contribute they need a formula for how the contributions are divided.
Defined Benefit Plans - Employers contribute to plans (sometimes employee contributions are either required or voluntary) that provide a pedictable benefit. It is a a administratively complex plan.
Money Purchase Plan - The employer is required to contribute to this plan for the employees. The plan states the contribution percentage that is required for the employees each year.
ESOPs (Employee Stock Ownership Plans) - A qualified defined contribution plan of a stock bonus plan or stock bonus / money purchase plan. Investment is primarily in qualifying employer securities.
Government Plans - Governmental retirement plans are 401(a) plans are established and maintained for employees by the United States or it's agencies and states as well as Indian tribal governments. Government plans also include 403(b) tax sheltered annuity plans, 457 deferred compensation plans, qualified excess benefit arrangements and some401(k) plans.
457(b) Deferred Compensation Plans - May only be set up by state or local governments and tax-exempt organizations. Employers or employees contribute through salary reductions. Contributions and earnings are tax deferred. However, plans can be ammended to allow for Roth IRA contributions.
403b Tax sheltered annuity plan - A retirement plan offered by public schools and certain tax-exempt organizations. Employers and employees can contribute to employee's individual accounts.
Bitcoin investment information for those trying to learn how to get started.
Age |
Investment Beginning of Year |
Beginning of Year Value After Investment Before Withdrawal |
Rate of Growth |
Beginning of Year Withdrawal |
Value End of Year |
20 |
$2,000 |
$2,000 |
8% |
0 |
$2,160.00 |
21 |
$2,000 |
$4,160 |
8% |
0 |
$4,492.80 |
22 |
$2,000 |
$6,493 |
8% |
0 |
$7,012.22 |
23 |
$2,000 |
$9,012 |
8% |
0 |
$9,733.20 |
24 |
$2,000 |
$11,733 |
8% |
0 |
$12,671.86 |
25 |
$2,000 |
$14,672 |
8% |
0 |
$15,845.61 |
26 |
$2,000 |
$17,846 |
8% |
0 |
$19,273.26 |
27 |
$2,000 |
$21,273 |
8% |
0 |
$22,975.12 |
28 |
$2,000 |
$24,975 |
8% |
0 |
$26,973.12 |
29 |
$2,000 |
$28,973 |
8% |
0 |
$31,290.97 |
30 |
$2,000 |
$33,291 |
8% |
0 |
$35,954.25 |
31 |
$2,000 |
$37,954 |
8% |
0 |
$40,990.59 |
32 |
$2,000 |
$42,991 |
8% |
0 |
$46,429.84 |
33 |
$2,000 |
$48,430 |
8% |
0 |
$52,304.23 |
34 |
$2,000 |
$54,304 |
8% |
0 |
$58,648.57 |
35 |
$2,000 |
$60,649 |
8% |
0 |
$65,500.45 |
36 |
$2,000 |
$67,500 |
8% |
0 |
$72,900.49 |
37 |
$2,000 |
$74,900 |
8% |
0 |
$80,892.53 |
38 |
$2,000 |
$82,893 |
8% |
0 |
$89,523.93 |
39 |
$2,000 |
$91,524 |
8% |
0 |
$98,845.84 |
40 |
$2,000 |
$100,846 |
8% |
0 |
$108,913.51 |
41 |
$2,000 |
$110,914 |
8% |
0 |
$119,786.59 |
42 |
$2,000 |
$121,787 |
8% |
0 |
$131,529.52 |
43 |
$2,000 |
$133,530 |
8% |
0 |
$144,211.88 |
44 |
$2,000 |
$146,212 |
8% |
0 |
$157,908.83 |
45 |
$2,000 |
$159,909 |
8% |
0 |
$172,701.54 |
46 |
$2,000 |
$174,702 |
8% |
0 |
$188,677.66 |
47 |
$2,000 |
$190,678 |
8% |
0 |
$205,931.87 |
48 |
$2,000 |
$207,932 |
8% |
0 |
$224,566.42 |
49 |
$2,000 |
$226,566 |
8% |
0 |
$244,691.74 |
50 |
$2,000 |
$246,692 |
8% |
0 |
$266,427.07 |
51 |
$2,000 |
$268,427 |
8% |
0 |
$289,901.24 |
52 |
$2,000 |
$291,901 |
8% |
0 |
$315,253.34 |
53 |
$2,000 |
$317,253 |
8% |
0 |
$342,633.61 |
54 |
$2,000 |
$344,634 |
8% |
0 |
$372,204.30 |
55 |
$2,000 |
$374,204 |
8% |
0 |
$404,140.64 |
56 |
$2,000 |
$406,141 |
8% |
0 |
$438,631.89 |
57 |
$2,000 |
$440,632 |
8% |
0 |
$475,882.44 |
58 |
$2,000 |
$477,882 |
8% |
0 |
$516,113.04 |
59 |
$2,000 |
$518,113 |
8% |
0 |
$559,562.08 |
60 |
$2,000 |
$561,562 |
8% |
0 |
$606,487.05 |
61 |
$2,000 |
$608,487 |
8% |
0 |
$657,166.01 |
62 |
$2,000 |
$659,166 |
8% |
0 |
$711,899.29 |
63 |
$2,000 |
$713,899 |
8% |
0 |
$771,011.23 |
64 |
$2,000 |
$773,011 |
8% |
0 |
$834,852.13 |
65 |
$2,000 |
$836,852 |
8% |
0 |
$903,800.30 |
66 |
0 |
$903,800 |
8% |
$70,000 |
$900,504.33 |
67 |
0 |
$900,504 |
8% |
$70,000 |
$896,944.67 |
68 |
0 |
$896,945 |
8% |
$70,000 |
$893,100.25 |
69 |
0 |
$893,100 |
8% |
$70,000 |
$888,948.27 |
70 |
0 |
$888,948 |
8% |
$70,000 |
$884,464.13 |
71 |
0 |
$884,464 |
8% |
$70,000 |
$879,621.26 |
72 |
0 |
$879,621 |
8% |
$70,000 |
$874,390.96 |
73 |
0 |
$874,391 |
8% |
$70,000 |
$868,742.24 |
74 |
0 |
$868,742 |
8% |
$70,000 |
$862,641.62 |
75 |
0 |
$862,642 |
8% |
$70,000 |
$856,052.95 |
76 |
0 |
$856,053 |
8% |
$70,000 |
$848,937.18 |
77 |
0 |
$848,937 |
8% |
$70,000 |
$841,252.16 |
78 |
0 |
$841,252 |
8% |
$70,000 |
$832,952.33 |
79 |
0 |
$832,952 |
8% |
$70,000 |
$823,988.52 |
80 |
0 |
$823,989 |
8% |
$70,000 |
$814,307.60 |
81 |
0 |
$814,308 |
8% |
$70,000 |
$803,852.21 |
82 |
0 |
$803,852 |
8% |
$70,000 |
$792,560.38 |
83 |
0 |
$792,560 |
8% |
$70,000 |
$780,365.21 |
84 |
0 |
$780,365 |
8% |
$70,000 |
$767,194.43 |
85 |
0 |
$767,194 |
8% |
$70,000 |
$752,969.98 |
86 |
0 |
$752,970 |
8% |
$70,000 |
$737,607.58 |
87 |
0 |
$737,608 |
8% |
$70,000 |
$721,016.19 |
88 |
0 |
$721,016 |
8% |
$70,000 |
$703,097.48 |
89 |
0 |
$703,097 |
8% |
$70,000 |
$683,745.28 |
90 |
0 |
$683,745 |
8% |
$70,000 |
$662,844.91 |
91 |
0 |
$662,845 |
8% |
$70,000 |
$640,272.50 |
92 |
0 |
$640,272 |
8% |
$70,000 |
$615,894.30 |
93 |
0 |
$615,894 |
8% |
$70,000 |
$589,565.84 |
94 |
0 |
$589,566 |
8% |
$70,000 |
$561,131.11 |
95 |
0 |
$561,131 |
8% |
$70,000 |
$530,421.60 |
96 |
0 |
$530,422 |
8% |
$70,000 |
$497,255.33 |
97 |
0 |
$497,255 |
8% |
$70,000 |
$461,435.75 |
98 |
0 |
$461,436 |
8% |
$70,000 |
$422,750.61 |
99 |
0 |
$422,751 |
8% |
$70,000 |
$380,970.66 |
100 |
0 |
$380,971 |
8% |
$70,000 |
$335,848.31 |
This illustration is not suppose to be indicative of any particular investment and is shown only as one possible scenerio for a hypothetical plan. Investments and returns vary according to their plans. Please speak to your investment advisor before making any investments. Information and the investment tables are made available to you as self-help tools for your independent use and are not intended to provide investment advice. We can not and do not guarantee their applicability or accuracy in regard to your individual circumstances. All examples are hypothetical and are for illustrative purposes. We encourage you to seek personalized advice from qualified professionals regarding all personal finance issues.
Some other scenerios using different hypothetical ages, growth rates and withdrawals.
Age 2, $600 annual investment, 8% return, and $88,000 withdrawal
Age 10, $1,200 annual investment, 8% return, and $92,000 withdrawal
Age 25, $2,000 annual investment, 8% return, and $48,000 withdrawal
Age 30, $2,000 annual investment, 8% return, and $30,000 withdrawal
Age 35, $2,000 annual investment, 8% return, and $21,000 withdrawal
Age 40, $2,000 annual investment, 8% return, and $13,500 withdrawal
Age 49, $2,000 annual investment, 8% return, and $15,000 withdrawal
Age 55 $2000 annual investment, 8% return, and $5,000 withthrawal
References: Moneychimp, 2020, Compound annual growth rate (annualized return), http://www.moneychimp.com/features/market_cagr.htm
Home - Privacy - Contact / Advertise
Copyright © 2014-2022 retirementtable.com. All Rights Reserved.